The American Lung Association released its 2026 State of the Air report this week. The headline finding: 33.5 million children in the United States, 46% of people under 18, live in a county that received a failing grade for at least one measure of air pollution.
That number is alarming. But it doesn't answer the question that matters most for health system planning: where does bad air quality converge with populations that are already sick, providers that are already scarce, and social conditions that make everything harder?
We cross-referenced the ALA's county-level air quality findings against our compound signal scoring system, which evaluates every US county across four dimensions: Environmental Risk, Disease Burden, Provider Gap, and Social and Economic Stress. The results reveal that air quality alone tells a misleading story about community health risk.
Most Counties With Bad Air Are Fine. A Few Are Not.
Of the 860 US counties that exceed EPA air quality standards for ozone or particulate matter (our proxy for the ALA's failing grades, using 2022–2024 EPA AQS monitoring data), 801 do not carry compound health system risk signals. That's 93%. In those counties, bad air is a real problem, but the healthcare system, provider supply, and social infrastructure are intact enough to absorb the health consequences.
The remaining 59 counties are different. These are places where failing air quality converges with elevated disease burden, provider shortage, or social vulnerability. They represent 6.9% of air-quality-failing counties, but they concentrate the most acute and most underserved environmental health risk in the country.
Approximately 1.55 million children live in these 59 convergence counties, based on Census ACS county-level population counts for residents under 18. That's 4.6% of the ALA's 33.5 million figure. But these are the children at greatest compound risk: breathing unhealthy air in communities where respiratory disease is already elevated, the nearest pulmonologist may be counties away, and the social safety net is thinnest.
The Triple Threat: Bad Air, Sick Population, No Providers
We identified 18 counties that fail on air quality AND have elevated disease burden AND have elevated provider gap. These are places where all three factors converge simultaneously. Nearly 79,000 children live in these counties.
Jackson County, South Dakota (population 2,776) exemplifies the pattern. One-third of its residents are children. Asthma prevalence runs at 13.2%, COPD at 12.3%, and its provider gap score sits at the 98th national percentile, meaning virtually no specialty healthcare access. The county exceeds EPA air quality standards based on 2022–2024 monitoring data, but it's too small to appear on any metropolitan pollution ranking.
Butte County, Idaho (population 2,758) is the only county in the United States where all four health system risk dimensions are simultaneously elevated above the 70th percentile. It also exceeds EPA air quality standards. COPD prevalence runs at 11.8%, with a provider gap score at the 96th percentile.
Jefferson County, Oklahoma (population 5,347) combines air quality that exceeds EPA standards with 11.7% asthma prevalence, 11.6% COPD, and a provider gap at the 81st percentile. Its Social and Economic Stress score sits at the 98th percentile.
What these counties share is a profile that air quality grades alone cannot capture. The ALA report identifies them as having bad air. Our analysis adds: the populations living in that bad air are already sick with the diseases air pollution worsens, the healthcare system is not equipped to treat them, and the social conditions upstream are among the worst in the country.
The States Where Air Quality and Health System Risk Converge
Oklahoma has the highest convergence rate: 34.8% of its air-quality-failing counties also carry compound signals, and 11 of its 23 failing counties have elevated respiratory burden scores. The pattern is ozone-driven, with multiple counties in eastern Oklahoma showing ozone levels well above the federal standard alongside high COPD and asthma prevalence.
Arkansas (37.5% convergence rate), Mississippi (33.3%), Idaho (33.3%), and Alabama (28.6%) round out the top five by percentage.
Texas has the most air-quality-failing counties overall (43), but only 8 carry compound signals. The pattern in Texas is similar to what we've documented in other analyses: urban and suburban Texas counties have bad air but strong healthcare infrastructure, while the compound signal counties are concentrated in rural areas where provider access and social conditions amplify the air quality problem.
39 Rural Counties Nobody Is Talking About
The ALA report produces ranked lists of the most polluted metropolitan areas. Los Angeles, Phoenix, Bakersfield, and Fresno dominate those lists. But metropolitan rankings by definition exclude the rural counties where compound risk is often highest.
Our analysis identified 39 rural counties (population under 50,000) that fail on air quality and carry compound signals. These counties would never appear on the ALA's “most polluted cities” lists because they're too small. But the people living in them face the same air quality problems with far less healthcare infrastructure to manage the consequences.
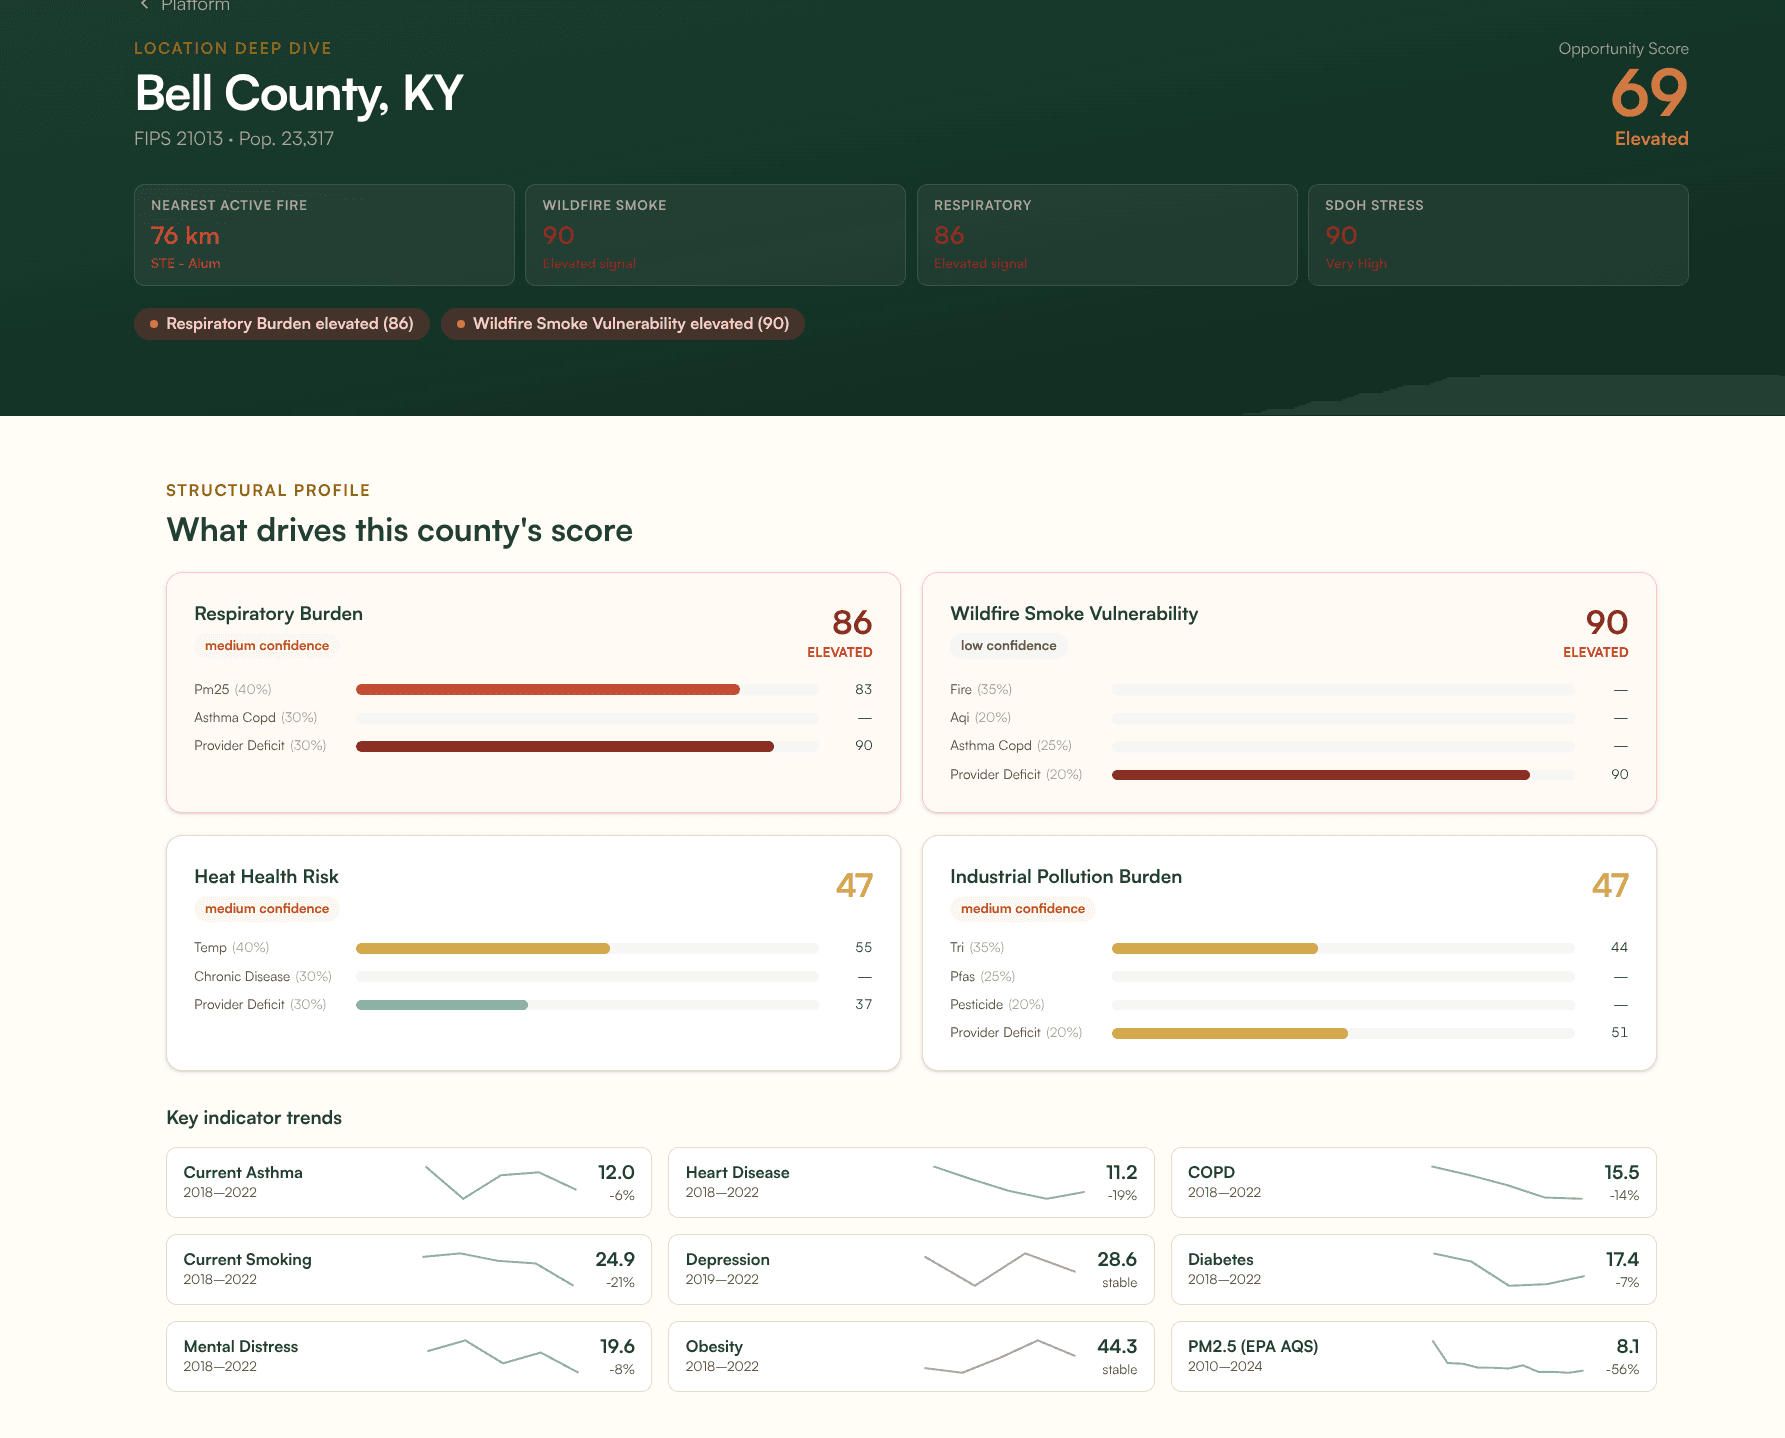
Bell County, Kentucky (population 23,317) has one of the most severe respiratory disease profiles in the country. Its COPD prevalence is 15.5%, nearly three times the national average, with asthma at 12.0%. Depression prevalence runs at 28.6% and the adult smoking rate is 24.9%. PM2.5 levels run at 8.1 micrograms per cubic meter. As of this writing, the nearest active fire is 76 km away. Bell County's wildfire smoke vulnerability score is 90 out of 100, reflecting that real-time fire proximity layered on top of a population already devastated by respiratory disease. It would not appear on any “most polluted cities” list.
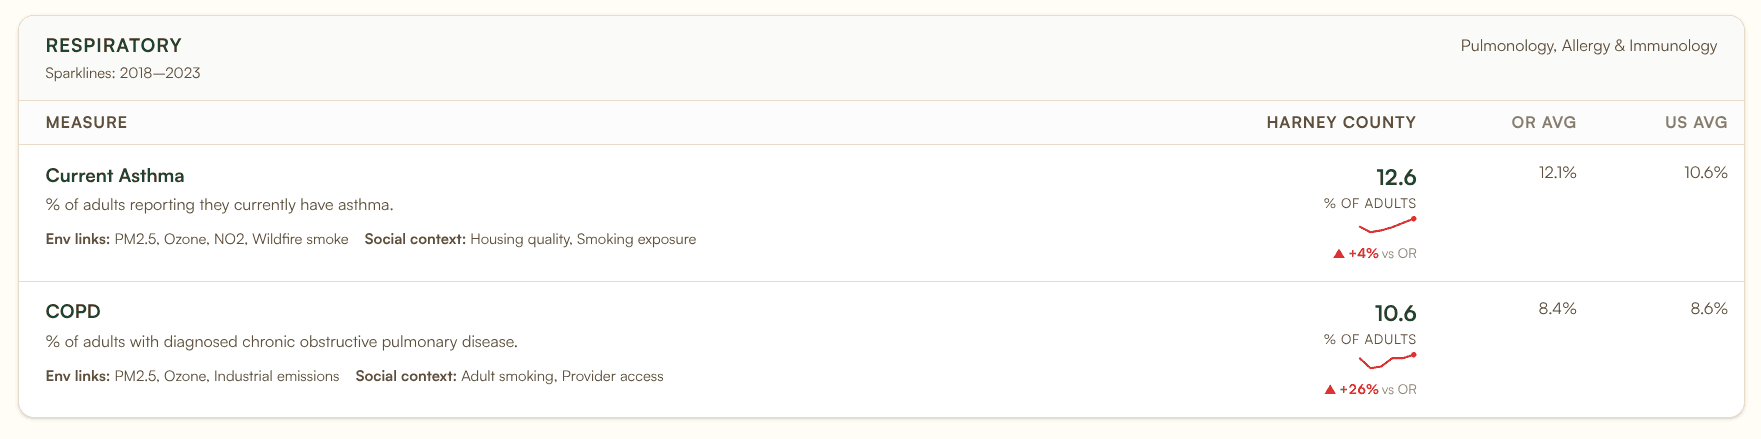
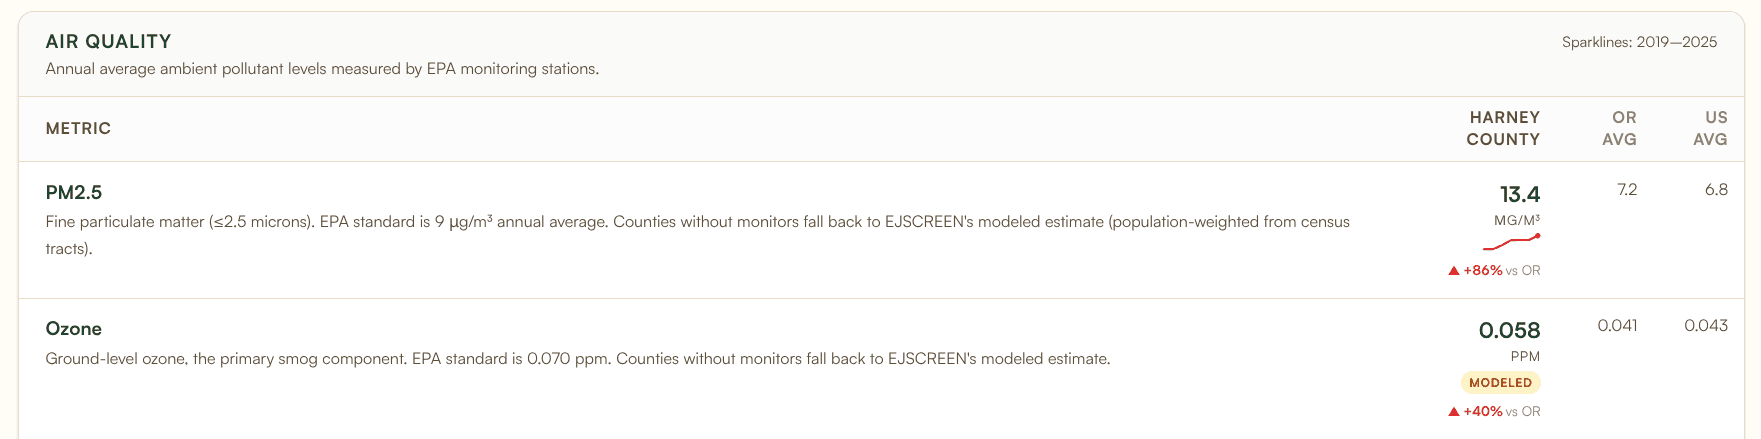
Harney County, Oregon (population 7,440) has PM2.5 levels of 13.4 micrograms per cubic meter, 86% above the Oregon state average and well above the federal annual standard, driven by wildfire smoke in the high desert. Asthma prevalence is 12.6% and COPD runs at 10.6%, both above state and national averages. It would not appear on any metropolitan ranking.
These are the hidden-risk counties that exposure-only analysis misses. The air quality data says the air is bad. The compound signal data says the community's ability to cope with that bad air is also compromised.
Why Air Quality Grades Alone Don't Tell the Full Story
The 801 counties that fail on air quality but carry no compound signal are just as important as the 59 that do. They demonstrate that exposure is not the same as risk.
A county in suburban Atlanta might have elevated ozone from traffic and industrial sources. It fails the ALA grade. But it also has strong healthcare access, relatively low chronic disease prevalence, and social infrastructure that provides a buffer. The air is bad, but the system can handle it.
A county in rural Oklahoma might have similar ozone levels. It also fails the ALA grade. But it has COPD prevalence double the national average, the nearest pulmonologist is in the next county, and the social and economic profile shows deep economic and social stress. The air is bad, and the system cannot handle it.
Both counties receive the same failing grade in the ALA report. They are not facing the same problem.
This is why we built compound signal detection. Single-dimension analysis (whether it's air quality alone, disease burden alone, or provider access alone) identifies problems. Multi-dimensional convergence analysis identifies where those problems pile up in the same geography with no offsetting strengths. That's where the need is greatest and the intervention opportunity is highest.
What This Means for CHNAs and Health System Planning
For hospitals and health departments conducting Community Health Needs Assessments, the ALA report is valuable input. Air quality is a real health determinant. But incorporating it into a CHNA without also evaluating disease burden, provider access, and social determinants in the same geography risks misallocating attention.
A hospital system in a state like Oklahoma, where 34.8% of air-quality-failing counties also carry compound signals, should be asking: which of our service area counties have bad air AND high respiratory disease AND limited pulmonology access? The answer to that question is more actionable than a list of counties with bad air.
The full compound signal methodology, including how we score environmental risk alongside disease burden, provider access, and social determinants, is available at banana-analytics.com/methodology.